
On this page
3
Elaboration of the MEIP
The 2025 edition of the Mediterranean Electrical Interconnection Perspectives (MEIP) report builds on the consolidated planning methodology developed and refined by Med-TSO through its previous study projects, aimed at the coordinated study and development of interconnection projects across the Mediterranean. This methodology is designed to support the energy transition and the evolution of power grids in a cost-effective, secure, and regionally integrated manner.
The interconnection projects are evaluated against a set of long-term energy scenarios that reflect potential evolutions in electricity demand and generation. These scenarios provide a robust analytical foundation for grid planning studies, allowing for a comprehensive assessment of project impacts from both technical and economic perspectives. The evaluation process integrates results from market simulations and network analyses to inform investment decisions.
The methodology includes the following key steps:
- Definition of Mediterranean energy projects.
- Identification of future interconnection projects.
- Development of regional power system models for market studies.
- Load flow analysis and assessment of infrastructure requirements to meet security standards.
- Cost-Benefit Analysis (CBA) of proposed investments.
While the MEIP 2025 report maintains the core methodological framework of the Med-TSO Master Plan, it introduces updated scenario assumptions and revised CBA results. The projects analysed in this edition are expected to be implemented by 2040, extending the planning horizon beyond that of the Master Plan report published earlier in 2025, which focused on projects targeted for implementation by 2030.
MEIP 2025 therefore complements the Master Plan by identifying and assessing additional interconnection projects necessary to meet the evolving energy needs of the region over the next two decades. These projects reflect a long-term vision for regional integration and system flexibility, aligned with the broader goals of decarbonisation, energy security, and market development across the Mediterranean.
In addition, MEIP 2025 includes the preliminary market assessment of a set of exploratory projects, primarily focused on market analysis. These are conceptual interconnections rather than committed projects, designed to explore the potential evolution of cross-border exchanges beyond 2040. This forward-looking exercise ensures that all plausible future developments in regional connectivity are considered, providing valuable insights into strategic directions that Mediterranean electricity systems could take under various long-term scenarios.
3.1
Projected evolution of Mediterranean power systems by 2040
The Scenario-Building Process developed by Med-TSO serves as the foundation for assessing future energy needs. It delivers a quantitative basis for infrastructure assessment and network planning by defining a set of plausible futures against which system performance can be tested. In practice, these scenarios are designed to capture the dynamic uncertainties of the energy transition.
The Med-TSO framework includes three long-term scenarios: Inertial, Proactive and Mediterranean Ambition, which represent different levels of interaction among national power systems, ultimately aiming at a more coordinated Mediterranean Power System. These 2040 scenarios outline possible pathways from the present to a range of future trends in energy demand, electricity generation, sector coupling, technological development, policy directions, and decarbonisation goals. They provide a solid foundation for grid development studies.
INERTIAL SCENARIO
No breakthrough in the midterm
Under a scenario of moderate GDP and electricity consumption growth – factors that influence electricity demand more significantly in MENAT countries than in European countries – the Inertial scenario implies the achievement of mid-term energy targets aligned with RePowerEU and Fit-for-55 objectives for Europe. However, international cooperation remains limited beyond the European context.
In the Inertial scenario (IN), energy policies primarily prioritise local and national implementation, largely due to persistent disparities in power sector regulations among Mediterranean regions and countries. The advancement of RES is steadily but moderately progressing, in alignment with national energy policies. Within this context, the development of green hydrogen exhibits only marginal progress, primarily due to the absence of robust regionally coordinated policies and integration. There is no distinct preference towards small-scale, decentralised plants or large, centralised ones. Overall, progress in the adoption of electric vehicles and electrification in other sectors, as well as energy efficiency measures, remains sluggish, except for a select few countries that have implemented strong incentive policies
PROACTIVE SCENARIO
Bottom-up boost of distributed generation and electrical devices at the consumer level
With a significant increase in GDP and electricity consumption, there is a stronger commitment to achieving a more sustainable energy sector, leading to an intensified development of renewable energy sources in support of EU climate neutrality by 2050. However, international cooperation among MENAT countries remains limited and robust energy policy integration is still lacking.
In the Proactive scenario (PR), the development of RES is primarily driven by local solutions and tailored regulations or incentives that encourage widespread investment at the consumer and prosumer levels. This approach is integrated with smart energy management systems in homes and buildings.
Certain countries are accelerating the integration of green hydrogen strategies, the adoption of electric vehicles, and promoting electrification in other end-use sectors alongside implementing energy efficiency measures. However, significant disparities persist among countries. The implementation of distributed generation reduces reliance on grids and minimises energy losses, although interconnections remain crucial due to the higher penetration of RES.
MEDITERRANEAN AMBITION SCENARIO
Top-down boost for supra-national cooperation and utility-scale developments
With a notable increase in GDP and electricity consumption, there is a heightened aspiration for a more sustainable energy sector, resulting in an intensified development of renewable energy sources and a stronger commitment to achieving climate neutrality by 2050. Moreover, there is an improved level of cooperation in the Green Transition, encompassing policy integration, financing, industry collaboration, and technology transfer.
This collaborative effort extends across the Mediterranean region, with a multilateral and regional approach that emphasises significant advancements in energy policy integration, regulatory harmonisation, and technical cooperation among grid operators.
In the Mediterranean Ambition scenario (MA), the significant growth of renewable energy sources is facilitated mainly through utility-scale projects, supported by institutional agreements and international cooperation, including off-take agreements. The abundance of carbon-free energy sources also fosters the exploration of new applications for electricity, such as green hydrogen, as well as deep electrification of buildings and industrial processes, which are increasingly embraced in national and regional strategies. Additionally, there is a stronger impetus towards energy efficiency. This scenario underscores the complementary nature of diverse countries’ approaches in implementing large-scale projects.
Regarding EU-27 countries, both the Proactive and Mediterranean Ambition scenarios aim to reach full decarbonisation in 2050, with two contrasting pathways proposed in the TYNDP2024 approach: Proactive focuses more on renewable development and decentralised options, while Mediterranean Ambition favours a centralised low-carbon option and more electricity interconnections.
The Mediterranean Ambition scenario stands out from the other two due to one particular driver: enhanced regional cooperation between Mediterranean countries. This scenario considers major changes in energy policy integration, regulatory coordination, and technical and financial cooperation.
Among the most essential aspects that this cooperation should encompass, the industrial dimension, for example, could maximise the share of local manufacturing of energy equipment (and thereby boost employment) in the countries concerned. Access to the most favourable credit conditions is also crucial for supporting investments in renewable energy and related technologies.
Most MENAT countries currently perceive the lack of tangible progress in international cooperation as an obstacle to the full implementation of the policies and investments identified to successfully achieve the energy transition.
Overcoming this obstacle will be crucial to unlocking the full potential of the region’s energy resources and fostering sustainable development. Enhanced collaboration among Mediterranean nations can pave the way for a more integrated energy market, ultimately benefiting all participating countries.
The table below provides a concise overview of how each of the key parameters influencing long-term electricity consumption trends is selected for the three scenarios.
| Drivers | Metrics | Inertial scenario | Proactive scenario | Mediterranean Ambition scenario |
|---|---|---|---|---|
| Macro-economic trends | GDP/Population growth | + | ++ | ++ |
| Energy transition & integration of energy policies | Green Transition and Paris Agreement, decarbonization targets achievement | + | ++ | +++ |
| Mediterranean integration, regional regulation, and Euro-Mediterranean cooperation on energy | + | + | +++ | |
| Electrification | Renewable hydrogen and derivatives | + | ++ | ++ |
| Other electrifications | + | +++ | +++ | |
| Power supply, RES development | RES development rate | ++ | +++ | +++ |
| Distributed vs large scale technologies | + (Large-scale) | +++ (More distributed) | ++ (Both with country adaptation) |
|
| Energy efficiency | Technological progress & energy efficiency (behavior and public polices) | + | ++ | ++ |
Legend: (one + stands for Low growth, ++ for Moderate growth, and +++ for High growth)
Table 1: Summary of storylines
These elements are presented in detail in another key deliverable of the TEASIMED 2 project: the Med-TSO Scenario Report for the 2030 and 2040 time-horizons. The report outlines how the evolution of power systems will influence the electricity exchanges between Mediterranean countries by 2040.
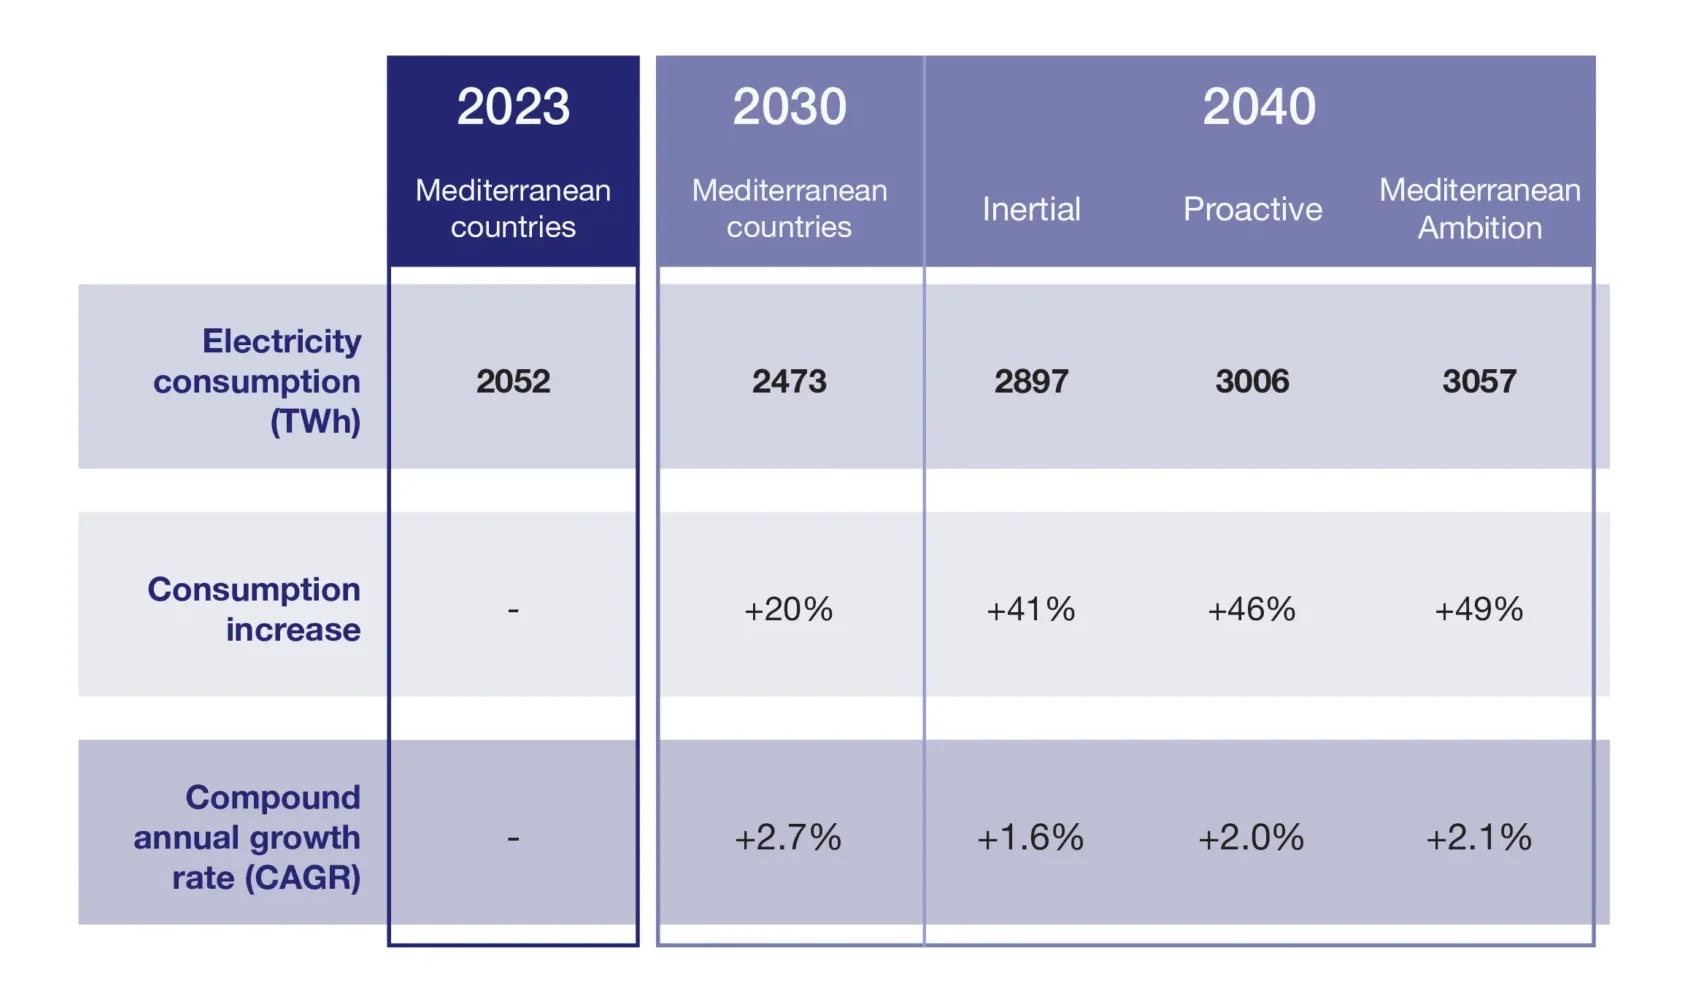
By 2040, the electricity demand is estimated to be between 2,900 and 3,060 TWh, depending on the scenario, representing an increase of approximately 40% to 50% compared to the reference year 2023, as depicted in Table 2.
Over the decade from 2030 to 2040, the average annual growth rate is expected to range from +1.6 to +2.1%. The higher consumption levels in the Proactive and Mediterranean Ambition scenarios, compared to the Inertial scenario, can be explained by a more favourable economic growth assumption (this factor remains the most decisive factor in North Africa, Middle East countries and Türkiye), as well as stronger electrification of the energy sector (mobility, industry, heating processes, etc.).
In the context of a significant increase in the installed capacity of renewable energy, Figure 2 illustrates the projected evolution of electricity production in the Mediterranean region up to 2040 under the different scenarios.
This increase is driven by the need to meet both the growing electricity consumption and the specific demand for green hydrogen production.
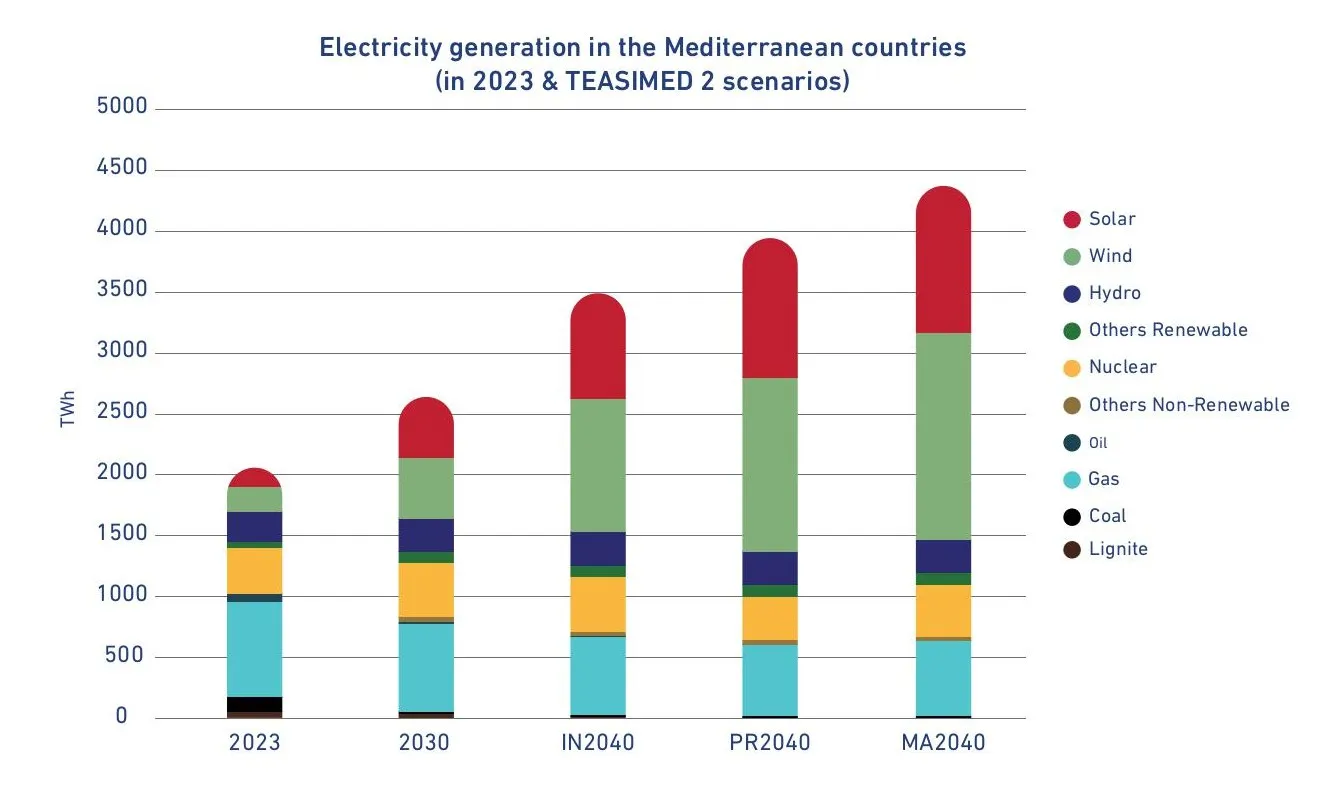
While the share of renewable energy production reached about one-third in 2023, it is expected to exceed 50% by 2030 and could account for up to 70% to 80% of the total demand by 2040, depending on the scenarios. Wind energy alone could supply up to 40% of total demand. This represents a major shift in the nature of Mediterranean power systems, which will need to adapt to the widespread integration of these technologies.
Connecting Mediterranean countries through an interconnection network enables electricity exchanges that are justified by the complementarities between the connected countries. These complementarities vary in nature, for example, economics with flows oriented towards the country where the production costs are the lowest compared to the countries where the production of electricity is more expensive. Complementarity can also result from a situation of deficit in a country which can then benefit, if necessary, from generation capacity from interconnected neighbouring countries. It can also result from the massive development of non-dispatchable renewable energies, the surplus of which at certain times of the day will be evacuated through interconnections.
3.2
Proposed investment clusters and project merits
The Mediterranean electricity network covers a large and diversified area, characterised by significant variability in generation mixes, weather conditions, renewable generation potential, demand patterns, etc. This diversity gives rise to a range of needs and opportunities to valorise throughout the area.
Therefore, to address specific system requirements that differ from one region to another, TSOs propose targeted investment clusters and interconnection projects. They also propose exploratory projects addressing borders currently not covered by promoted interconnection projects. To support the identification of clusters, covered system needs have been therefore classified into categories of project benefits, as summarised in the following table.
Some benefits find a direct quantification through cost-benefit analysis. This is the case, for example, of the merits related to the first macro category: welfare, sustainability and security of supply, which includes the economic welfare generated by the given project, the reduced RES curtailment and associated reduced CO2 emissions and the reduced energy not supplied (ENS). Other merits are assessed in qualitative terms and associated with projects through symbols and specific descriptions.
| Category | Detailed Project Benefits | Associated System Needs | Symbol |
|---|---|---|---|
| Welfare, sustainability and security of supply (SoS) | Reduce high price differentials between different market nodes/ countries. Positively contribute to the reduction of RES curtailment and CO2 emission levels. Contribute to solving adequacy and security of supply issues. | By increasing the net transfer capacity between market zones, cross-border interconnections enable additional flows of electricity from countries with lower production costs to countries with higher production costs. This reduces price differentials between zones, thus creating value for the consumer and the whole system. As a result of the additional enabled flow, interconnections do also directly contribute to reducing RES curtailment. Excess of renewable (and typically low-cost) electricity produced in a given zone can be exported to another, thus reducing the overall emission factor of the generation mix. Finally, imported electricity from other countries represents an additional resource during scarcity periods to ensure balancing between demand and supply, thus contributing to security of supply. | |
| Isolation | Fully or partially contribute to resolving the isolation of countries in terms of power system connectivity or to meeting specific interconnection targets | This benefit specifically addresses security of supply for isolated systems (e.g. islands) and those showing low level of connectivity. It might also be associated with projects which allow countries to reach interconnection targets (e.g., that set by the Clean Energy Package of the European Commission). | |
| Operation – Flexibility | Introduce additional system restoration mechanisms. Improve system flexibility and stability. Increase system voltage stability Contribute to the integration of new RES generation capacity. | In the coming years, flexibility needs are expected to evolve both in terms of nature and volume as a consequence of the introduction of more weather-dependent generation (in replacement of conventional fossil power generation) and power electronic-based devices. In this context , cross-border interconnections can play a key role in reducing overall flexibility needs and also covering some of them. Cross-border interconnections allow not only the exchange of energy, but also flexibility of services between countries belonging to the same interconnected power system, thus reducing overall flexibility needs. In some cases, interconnections can also provide some flexibility services themselves (e.g., through HVDC converter stations), thus contributing to covering some flexibility needs, including system restoration. The flexibility enabled and provided by interconnections ultimately contributes to the integration of a greater share of RES into the power system. | |
| Operation – Flows | Enable cross-border flows to overcome internal grid congestions. Mitigate loop flows in bordering systems. | By enabling new exchanges or increasing existing transfer capacity between market zones, cross-border interconnections could also be particularly effective to countries experiencing internal grid congestion and physical loop flows involving other market zones. |
Table 3: Project merits categories and description.
The benefits listed in Table 3 have been used by TSOs as a foundation for proposing cross-border interconnection projects conceived to answer specific needs, which have been assessed within the framework of the TEASIMED 2 project.
3.3
Market studies approach and CBA methodology
- TOOT approach – The Take One Out at a Time (TOOT) method, evaluates each project by removing it individually from the reference case. The benefits are measured by comparing the reference case and the reference case minus the TOOT project. This approach is generally applied to more mature projects that are already included in the reference case.
- PINT approach – The Put IN one at a Time (PINT) method, evaluates each candidate project by adding it individually to the reference case. The change in system indicators is measured by comparing the reference case and the reference case plus the PINT project. This approach is generally applied to less mature projects that are still in a preliminary or planning phase, which are not included in the reference case.
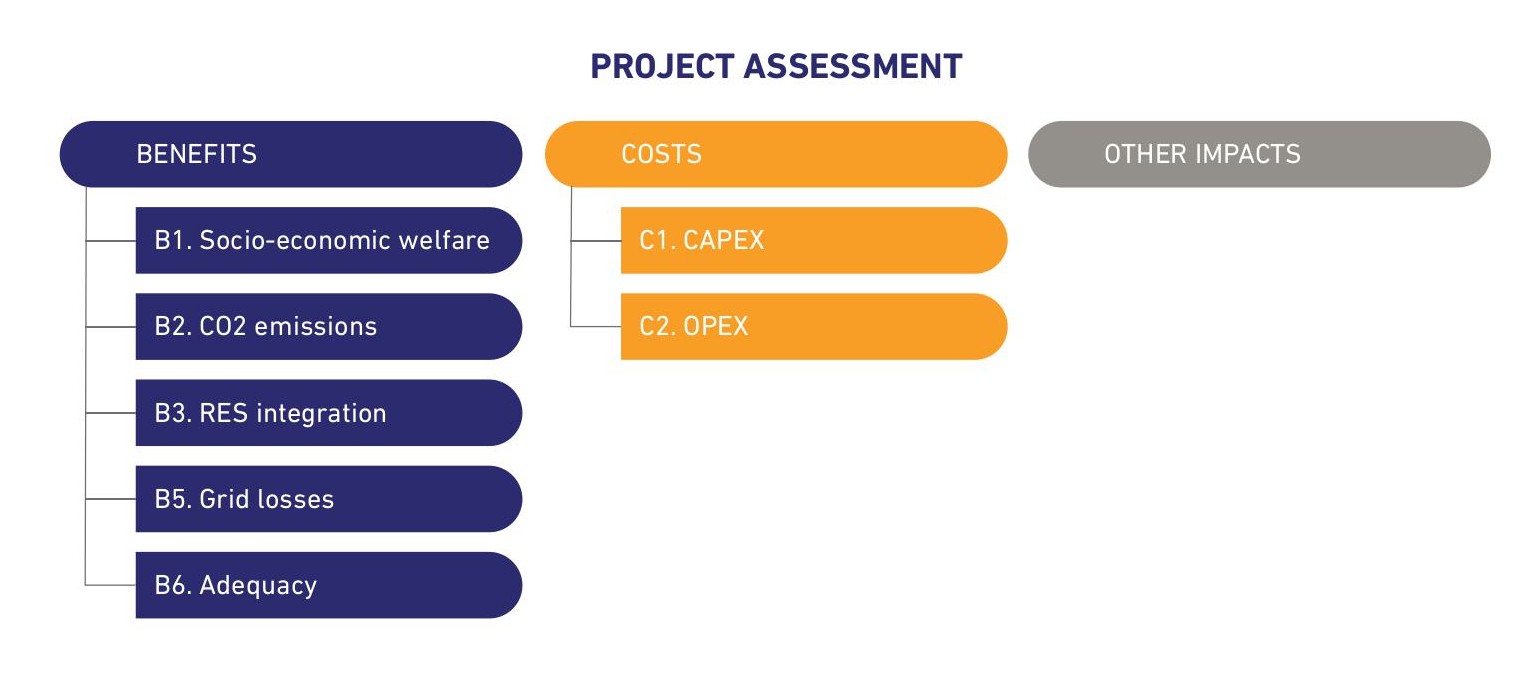
Reference case – This serves as the baseline grid configuration for the cost-benefit analysis, representing the most likely future network development based on projects with sufficient maturity and implementation certainty. In this TEASIMED 2 project, a total of 11 interconnection projects are assessed. Two of these (numbers 227 and 213) showing a more advanced level of project maturity are therefore included in the reference case for 2040. They have been assessed using the TOOT methodology, meaning that each of them has been studied by removing it from the reference case grid. The nine others have been evaluated by adding them individually to the reference case grid as per the PINT approach. The following set of common indicators provides a comprehensive and robust foundation for project assessment across the Mediterranean region within the scope of the Mediterranean Project. The multi-criteria approach highlights the key aspects, advantages and limitations of each project, offering sufficient information to support informed decision-making. The indicators are summarised in Figure 3 and described in subsequent sections.
B1. Socio-economic welfare (SEW), or market integration, measures a project’s ability to reduce congestion between bidding zones, thereby increasing transmission capacity and facilitating more efficient electricity trading across markets. SEW quantifies the annual cost savings achieved by the system thanks to the project, including fuel cost savings, monetised savings in CO₂ emissions, and variations in the expected energy not supplied (EENS). It is important to note, however, that SEW does not account for changes in grid losses, which are evaluated separately through a different indicator.
B2. Variation in CO₂ emissions captures the change in power system CO₂ emissions resulting from the implementation of a new project. It is a consequence of the effects measured in B1 (socio-economic welfare) and B3 (RES integration), as the project may enable the use of lower-carbon generation sources. Although the economic impact of CO₂ emission changes is already reflected in the SEW calculation, the CO₂ variation indicator is presented separately due to its strategic importance for the Mediterranean region’s decarbonisation goals.
B3. RES integration evaluates the system’s ability to connect new RES plants and enable both existing and future “green” generation, while minimising curtailments. Although this indicator is economically included in the calculation of SEW (since changes in RES integration affect energy from conventional sources and, in turn, system costs), RES integration remains a key objective in the Mediterranean region and is therefore presented separately.
B5. Variation in losses in the transmission grid captures changes in energy losses within the transmission grid resulting from the implementation of the new project, serving as a measure of energy efficiency. The variation in losses are determined through network simulations, as explained later in the document, and monetised using the hourly marginal electricity price, as determined in the market studies.
B6. Security of supply assesses the adequacy of the power system to meet electricity demand over an extended period, thus evaluating the impact of the reliability project. It accounts for the variability of weather conditions that influence both electricity demand and renewable energy generation. Monetisation of B6 is based on the value of lost load (VOLL) set at €3,000/MWh. In the SEW assessment, peak generation capacity is adjusted to ensure that the adequacy criterion – loss of load expectation (LOLE) – remains below three hours per year in every Mediterranean country.
Sector coupling
The modelling link between electricity and hydrogen systems via electrolysers establishes sector coupling. Electrolysers use surplus electricity from RES and/or nuclear sources to produce low-carbon hydrogen. As a result, the development of new interconnections can influence how electrolysers operate. In a simplified two-country scenario, increasing electricity export capacity reduces RES curtailment in the exporting country and delivers carbon-free electricity to the importing country. Depending on where the electrolysers are located, new interconnections may decrease or increase low-carbon hydrogen production.
The calculation of the B1 indicator must account for these mechanisms to capture the full value of SEW. The detailed modelling and calculation method is described in chapter 2.6.2 of the ENTSO–E document Implementation Guidelines for TYNDP 20224, based on 3rd ENTSOE Guidelines for Cost-Benefit Analysis of Grid Development Projects.
CBA reporting
The calculation of B1, B2, B3 and B6 indicators is performed over 35 climatic years for the Inertial scenario and three climatic years (1995, 2008, and 2009, similarly with TYDNP2024 climatic year selection) for the Proactive and Mediterranean Ambition scenarios. For each project, the average, minimum, and maximum values of the indicators are provided. The geographical scope for calculating those indicators not only covers the Mediterranean countries but the entire interconnected Euro-Mediterranean electricity system.
Indicator B5, Grid losses, is calculated with data corresponding to the climatic year “2000”, the year which presents the closest resemblance in terms of annual exchanges on the Mediterranean interconnections with the average of 35 climatic years.
3.4
Network studies
While market simulations are used to calculate several key benefits of interconnection projects from an energy market perspective, such as socio-economic welfare or CO₂ emissions reduction, network analyses are essential to assess the impact of these projects on the transmission network and identify the required internal reinforcements for a secure system operation. Once the reinforcements have been identified and implemented, the same type of network simulation is used to calculate the variation of network losses associated with the analysed project.
In TEASIMED 2, analyses have been based on a Continuous Load-Flow approach. With respect to more conventional network simulation methodologies based on a set of representative Points in Time (PiT), the approach is based on DC hourly load-flow simulation for a full climatic year, as described in the following section.
3.4.1 General Assumptions
The assessment of the investigated projects through network studies adopted a coherent approach to that illustrated in the previous chapter, and relied on the same TOOT and PINT methodologies. Furthermore, the reference grid (RG) for 2040 is consistent with the reference case previously mentioned for market simulations.
TOOT approach – The Take One Out at a Time (TOOT) method consists of excluding grid element projects from the reference network structure on a one-by-one basis and to evaluate the load flows over the lines with and without the examined network reinforcement (a new line, a new substation, a new PST, …)
PINT approach – The Put IN one at a Time (PINT) method considers each new item grid element on the given network structure one-by-one and evaluates the network flows over the lines with and without the examined network reinforcement.
Scenarios
This study covers three scenarios: the Inertial (IN) scenario, the Mediterranean Ambition (MA) scenario and the Proactive (PR) scenario.
For the Inertial scenario and for each project, complete network (N-state) and post-contingency (N-1) static studies have been performed. This in turn led to defining, in cooperation with each TSO, reinforcements to mitigate the violations that might appear. However, for Proactive and Mediterranean Ambition scenarios, only complete network (N) static studies (N) have been performed with the reinforced network emerging from the IN scenario analysis. Consequently, network reinforcements have only been proposed for these solutions.
3.4.2 Fundamentals of load flow analysis
- Evaluate the performance of the interconnected Mediterranean network by assessing its ability to transfer the bulk power flows resulting from the economic studies while ensuring the secure operation of the system.
- Identify potential criticalities related to the interconnections and the internal grids, in terms, for instance, of bottlenecks and voltage issues.
- Assess the need for internal reinforcements due to the new interconnections.
Network studies mainly involve load flow analyses, which compute the power flows and the bus voltages in an assigned electric system subject to the regulating capability of generators, reactive power sources, and on load tap‑changer transformers in different operating conditions and according to specific security criteria, as depicted in Figure 4.
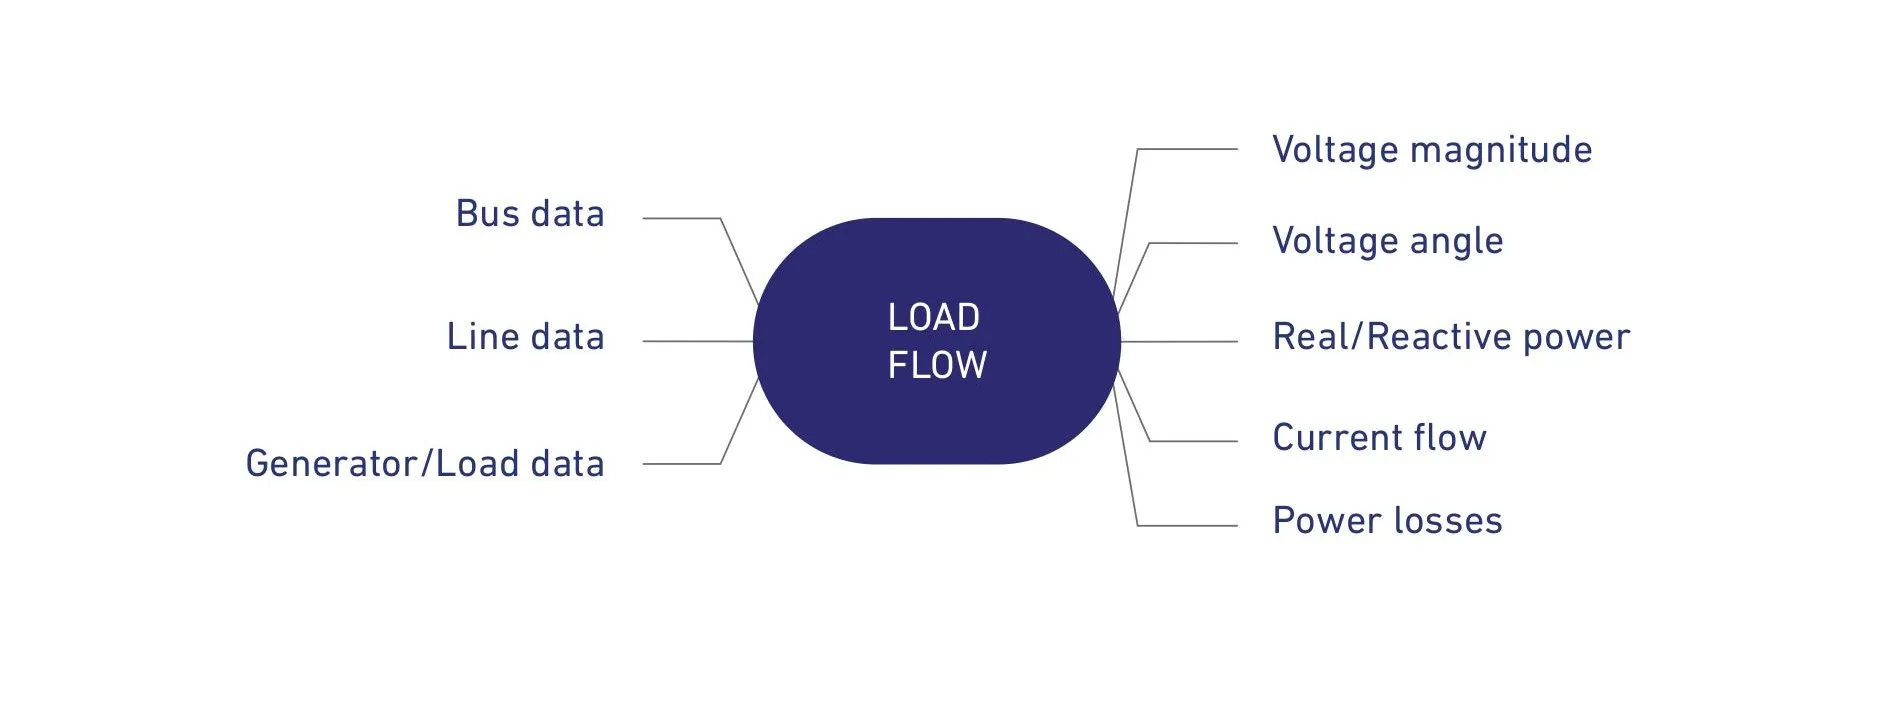
A parallel can be drawn with water flow in meshed pipelines with different inflow (generators) and outflow (load). A load flow describes how the water flow is distributed in the pipeline, helping to detect any problems in water distribution (e.g., overloads).
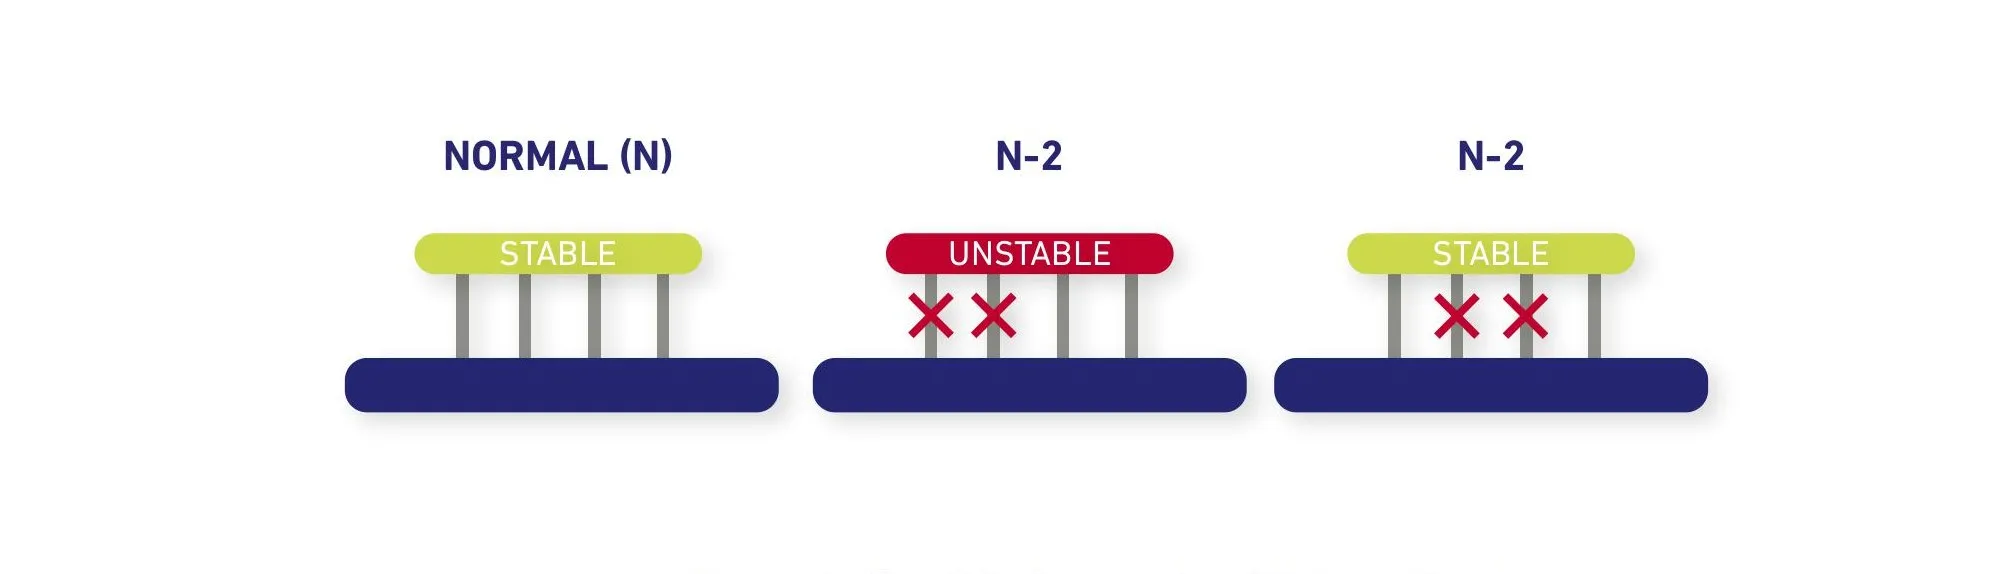
Load flow output is essential for the evaluation of the performance and security of a power system. Load flow analyses typically require the assessment of several cases in both normal and emergency operating conditions. Considering that the network includes a certain number of lines and transformers in normal (N) state, criteria (N-1) and (N-2) are defined to verify the ability of a system to operate even on a contingency with the lack of one element (N-1) or two elements (N-2) respectively, as presented in Figure 5 and Figure 6.
Such ability may depend on the specific system and the faulty elements. The figure below shows a simplistic example of how two different systems may become unstable without one or two elements or may remain stable depending on the elements selected and their spatial distribution. Similar behaviour can be observed in an electric network where the lack of one element can be easily compensated in a well-meshed network while it is not sustainable in weaker parts of the system.

A description of the security criteria includes:
- The acceptable voltage range in normal and contingency situations (i.e., ±5% in normal and ±10% in contingency or in general for generation buses)
- The threshold for admissible overloads of network elements (i.e., 20% for lines, 5-10% for transformers).
- Contingency criteria (N-1, identification of N-2, loss of a substation, remedial actions).
3.4.3 Continuous load flow methodology
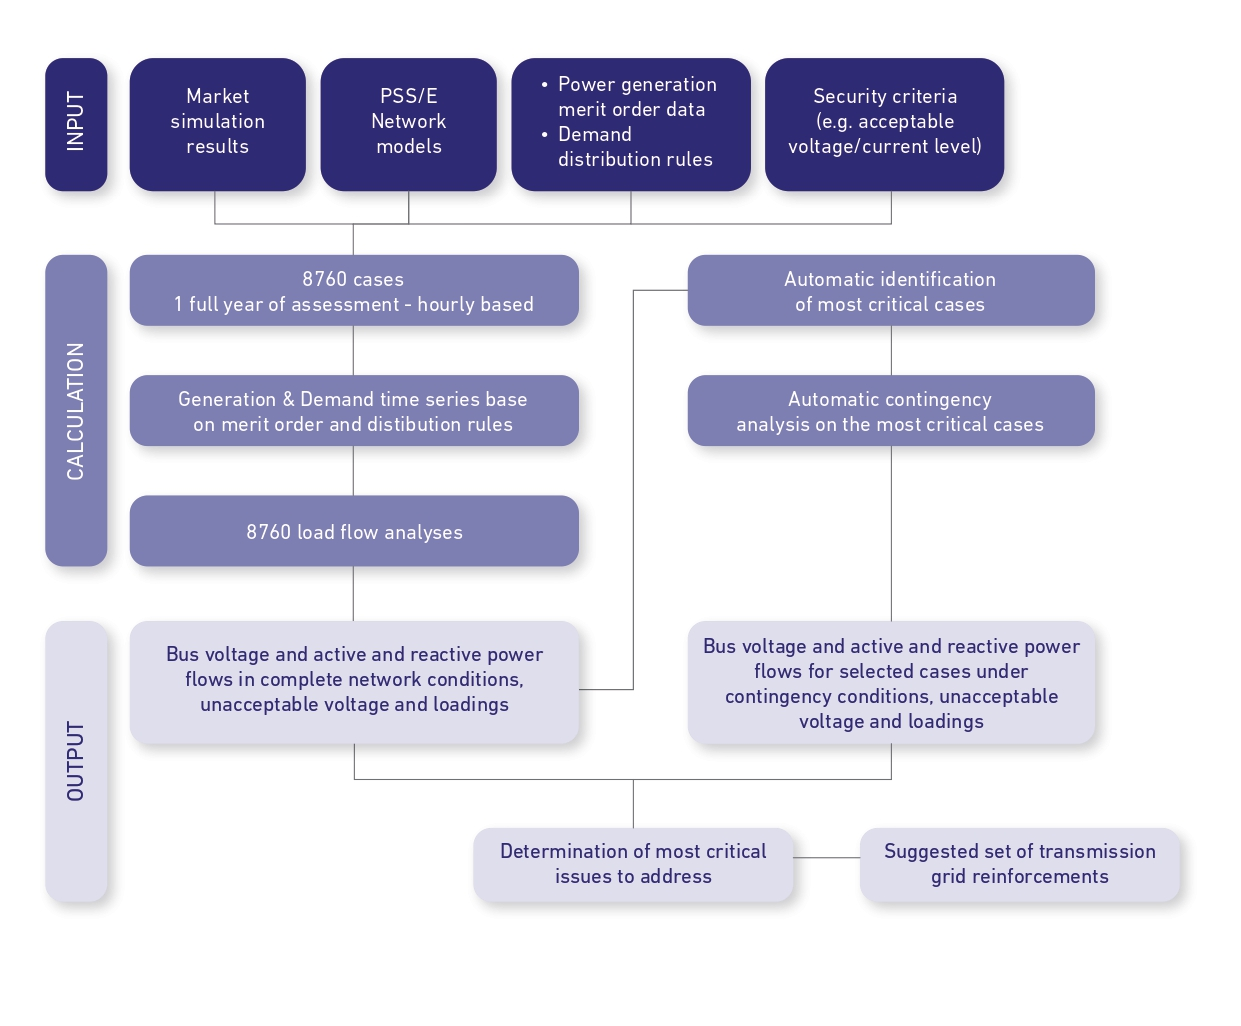
The continuous load flow approach implies the assessment of grid conditions over a full climatic year, for a total of 8,760-hour cases. As shown in the following diagram, the inputs for the calculation module include the market simulation results, the network models, and a set of security criteria needed to define dispatching conditions and verify grid quality standards to run 8,760 load flows. Resulting contingencies are automatically analysed to identify recurrent issues and select a set of most critical cases that require further investigation. The result of the investigation leads to the definition of transmission grid reinforcements needed for a secure operation of the electricity network including the assessed interconnection. The continuous load flow process is depicted in Figure 7.
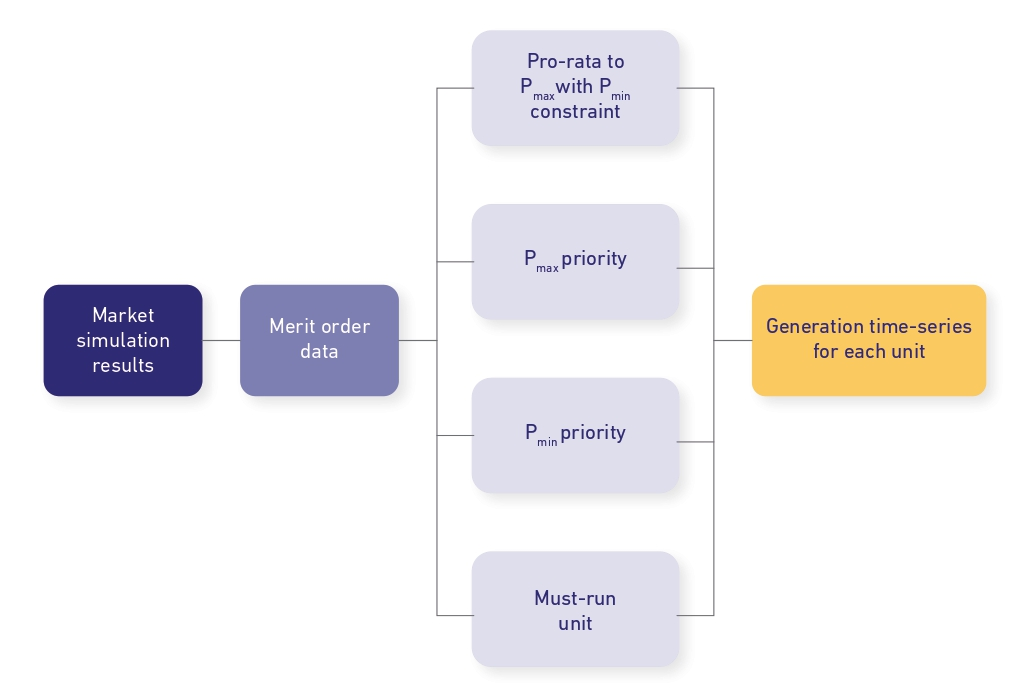
Dispatching conditions for power generation are determined through merit order ranking data, provided by TSOs for each country. The merit order is used to distribute the generation resulting from market simulations for each cluster (CCGT, OCGT, wind, PV, etc., in line with ENTSO-E’s classification) among power generation plants belonging to the same cluster and included in the network model. To reflect the typical operation of the electricity network as closely as possible, several power generation criteria are considered, as displayed in the diagram below (Figure 8).
For demand, there is no notion of merit order. Demand is therefore dispatched only by differentiating fixed and scalable loads.
With respect to PiT-based methodologies, the applied continuous load flow approach assesses a wider number of grid conditions, theoretically enabling more accurate and detailed identification of contingencies for further investigation. It also facilitates statistical analysis while delivering transparency on data calculated at each step.
In the previous TEASIMED project, to limit simulation time, contingency analysis was only performed on the cases that were deemed most critical for each country (between 1% and 5% of the total complete network situations). These critical cases were selected based on a tailored method elaborated by EDF experts to encompass all situations of importance, both within the countries and at their borders.
In TEASIMED 2, the use of a state-of-the-art programming language, and updated and refined automation algorithms, allowed us to unlock the full computation potential of our machines. C ontingency analyses were performed not only on the most critical cases, but on all 8,760 cases considered for the complete network analysis5. This, in turn, enriched the statistical approach used to assess the criticality of every contingency/violation pair.
The outputs of the contingency analysis included:
- The rate of the element
- The occurrence frequency of a Contingency/Violation pair
- The average violation value
- The maximum violation value
are retrieved and combined into a criticality index defined as follows to highlight the items to address as a priority.
This dimensionless value provides an order of magnitude of the necessity of either reinforcement or redispatch to address the grid code violations and allows for an intercomparison of otherwise very different events and items. Based on this numerical assessment, for each country, both contingencies and violations have been evaluated as shown in the table below.
This dimensionless value provides an order of magnitude of the necessity of either reinforcement or redispatch to address the grid code violations and allows for an intercomparison of otherwise very different events and items.
Based on this numerical assessment, for each country, both contingencies and violations have been evaluated as shown in the table below.
| Violation 1 | Violation 2 | Violation 3 | Violation 4 | Total Contingency | |
|---|---|---|---|---|---|
| Contingency A | - | γA2 | γA3 | - | γA |
| Contingency B | γB1 | γB2 | - | γB4 | γB |
| Contingency C | γC1 | - | - | γC4 | γC |
| Contingency D | - | - | γD3 | - | γD |
| Total Violation | γ1 | γ2 | γ3 | γ4 | - |
Table 4: Contingences and violations evaluation
3.4.4 Variation and monetisation of network losses
The final step of the network simulations is to compute the variation and monetisation of a network’s technical losses. For each project, this is conducted for the reference grid and includes the assessed project and the associated identified reinforcements. Grid losses are calculated directly as part of load-flow simulations for the two conditions, as the difference between the total generation and the total demand in a country. For underwater cables, losses are attributed equally to the countries involved.
Monetisation is then performed considering the marginal price of each market node obtained from market simulations that include the assessed project. The reference equation is the following:
Where Px is the assessed project.
This approach has the benefit of allowing the assessment of losses on an hourly basis for all 8,760 hours of the year. However, considering that continuous load-flow approach does not involve re-dispatching and relies on fixed power generation merit order information provided by TSOs, calculated losses might not fully reflect the true behaviour of network operation throughout the whole year. This phenomenon is, however, mitigated by the overall monetisation approach, which examines the variation of losses resulting from the assessed interconnection.
3.4.5 Analysis of the results of the network studies and investment costs
Planning an electrical transmission system can involve financial choices from among different technically feasible solutions. Making such decisions requires the quantification of costs of the various system components.
The main components to be considered are transmission lines, transformer substations and conversion stations in the case of HVDC transmission. Additional components might be involved in the case of specific identified reinforcements.
Costs for the design, construction and installation of components have been collected directly from Med-TSO members. When not available, standard costs or costs used in similar projects have been considered. For the scope of thisreport, the ratio of €1= $1,038 between euros and USD has been established.